Brain Evoked Potential Study
Posted at 00:31h in Services by doctor
Evoked potential is an electrical signal with which nerve cells respond to an external stimulus or to perform a mental task.
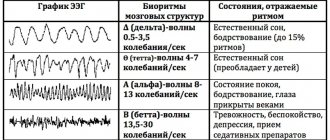
In 1929, HansBerger from Germany drew attention to the bioelectrical activity of the brain: when an electrical impulse is transmitted from one neuron to another, weak electrical waves arise, and an electroencephalograph device can record them.
The electroencephalogram reflects the general bioelectrical activity of brain activity. It was impossible to isolate from it the reaction to external stimulation of any individual visual or auditory analyzer at that time, since the biofield of the evoked potential (from 0.5 to 15 μV) is tens and hundreds of times weaker than the general activity of the brain (20 - 50 μV).
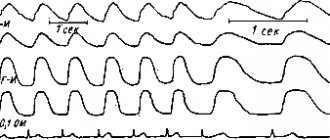
Only in the middle of the twentieth century did a device appear that made it possible to isolate weak amplitudes of evoked potential oscillations from the total amplitude of brain activity. This occurs using the summation method: stimulation that stimulates the potential being studied is repeated from 100 to 1000 times at precise time intervals.
The computer summarizes only those segments of the encephalogram (EEG) that immediately follow the sensory stimulation. If the total amplitude during this time can increase and decrease, take on positive and negative values and in total tend to zero, then the evoked potential has the same response form and accumulates depending on the number of stimuli given.
The more stimulating external influences, the lower the “noise level” of the overall activity. An evoked potential with a high intrinsic amplitude is isolated quite cleanly with the help of 50–60 repetitions, and a weak response to a stimulus requires more than 500 repetitions for its isolation.
- stimulus generator - a device made from electrodes on the head;
- bioelectric impulse amplifier
- analog-to-digital converter;
- computer for data processing;
- printer for printing.
How is the procedure carried out at the medical center in Khabarovsk?
The procedure is absolutely safe and painless for the child:
- Special electrodes are attached to the collarbone, chest and forehead.
- The baby's head is turned to the side to create tension in the sternocleidomastoid muscle.
- The results are recorded first when turning the head in one direction, then in the other, while the child hears a series of clicks through headphones.
- Registration of final results is carried out automatically.
Important!
In children with severe general somatic pathologies and infants, the procedure is performed during sleep.
Properties of evoked potentials
Necessary concepts for deciphering and interpreting the results:
- Latency is the time from the beginning of stimulation to the maximum value of the response impulse. Short-latency EPs (less than 0.050 sec); medium-latency (0.050 – 0.1 sec.); long-latency (longer than 0.1 sec.).
- Oscillation amplitude is the range of oscillation from maximum to minimum value.
- Polarity . To the same irritation, symmetrical parts of the brain can respond in diametrically opposite ways.
- Aftercharge is the decay time of the response pulse. It occurs 0.3 seconds after the stimulus is given and lasts from 0.5 seconds to 1 second).
Sensory evoked potentials are divided into visual, brainstem auditory, somatosensory, and motor. Studies of each of them make it possible to diagnose a variety of diseases of the nervous system.
Reaction of the organs of vision
Visual evoked potentials are bioelectrical impulses from the brain in response to irritation of the visual organs. They examine vision all the way from the retina to the centers in the cerebral cortex located in the occipital part, and can determine the location and nature of its damage.
Visually evoked potentials (VEPs) use the visual analyzer to assess the functioning of the nervous system. They assume that the patient is able to focus his vision and keep his gaze at one point.
If the patient has an injury to the eye, optic nerve, or impaired thinking abilities, the VEP method is not recommended. In most cases, stimulation is given to one eye using LED glasses.
- Reaction to a flash of light . The study is carried out for patients who cannot fix their gaze or have difficulty seeing at all; The method is used for early diagnosis of visual impairment in newborns. Flashes are stimulated using a matrix in LED glasses; they are presented monocularly. The patient is in a room isolated from light and sound, his eyes are closed. Working electrodes are connected to the occipital region; reference electrodes are usually ear or frontal. To obtain a satisfactory picture of evoked potentials, it is sufficient to carry out from 50 to 100 stimulations. The response to an external stimulus will be a series of oscillations - positive and negative - with the same latency.
- Reaction to a change in chess pattern . The subjects observe a frequent change of cells - black and white. Large cells stimulate peripheral vision, small cells mobilize central vision. To isolate evoked potentials, it is necessary to make 100–200 external stimuli.
Interpretation of results
The following values are taken for analysis: N75; P10; N145. The index N means the lowest level (peak) of the pulse; P is the highest. Numbers 75, 100,
145 means the latency (duration) of each peak.
- increased latency (due to impaired speed of impulses passing through the optic nerves;
- violation of symmetry, when readings from the right and left eyes differ (due to damage to the cerebral cortex);
- change in amplitude, both upward and downward. The P100 indicator is especially important for correct diagnosis.
Story
The evoked potential method became widespread in the field of cognitive neuroscience more than 40 years ago, in the 60s of the last century. The first attempt to separate evoked potentials into components was made in the 70s using factor analysis and the principal components method. However, these techniques only revealed orthogonal (in a strictly mathematical sense) components of evoked potentials, which is clearly a limitation since it is clear that the components are not necessarily orthogonal. The development of new methods for objective separation of components (such as the method of independent components) has overcome the shortcomings of old approaches and is opening up new research opportunities in this direction. The accumulated knowledge demonstrates the high efficiency and diagnostic power of the method for assessing independent components of evoked potentials as endophenotypes of brain dysfunction.
Brainstem evoked potentials to acoustic stimulation
Auditory evoked potentials are the response of the auditory nerve and parts of the brain (its stem part) to auditory stimuli.
The most common in medical practice are short-latency acoustic stimulation evoked potentials (ASEPs).
The sound signal along its path passes through 5 “stations” - departments of the central nervous system. Each of these centers responds to stimulation with an amplitude of bioelectric field oscillations with positive (P) and negative (N) peaks.
Amplitude bursts are produced by nerve centers in the following order: I. auditory nerve → II. cochlear nucleus →III. olive →IV. lateral lemniscus → V. inferior colliculus and cerebral cortex.
The signal transmission path of the auditory analyzer passes through the brain stem, which is associated with the vital functions of the body and its cognitive capabilities. Therefore, KASVP is used in assessing the condition of seriously ill patients in a coma, as well as in assessing a person’s intellectual activity.
The CASVP technique consists of using stimulation with short clicks, first on one ear, then on the other. Sound duration is 0.1 milliseconds, frequency is 10 clicks per second.
To record the evoked potential, the active electrode is placed on the crown, the control electrode is placed on the earlobe that receives the stimulus, and the ground electrode is placed on the opposite ear.
To accurately deduce CASVP from the general EEG background, the number of stimulating signals should be about 3000 with double averaging. The result is a graph of a wave function with five positive and negative peaks.
Interpretation of results
The absence of waves or the presence of only one amplitude instead of five indicates depression of vital centers and gives a poor prognosis for future life.
- the interval between I, II and III peaks is increased;
- amplitude III became smaller;
- waves of II, IV, V centers have changed.
Recent studies have established that component III of the evoked potential graph of the auditory analyzer - P300 (P is the designation of the positive peak, 300 is the latent period) is associated with cognitive evoked potentials.
A decrease in the amplitude of P300 and an extension of its latent period may indicate diseases of the intellectual sphere: schizophrenia, dementia, autism, parkinsonism, Alzheimer's disease.
Analysis of auditory evoked potentials is indispensable when searching for the causes of speech and hearing disorders in children, because make it possible to determine at what stage of sound signal transmission the failure occurs: either it is a peripheral disorder or a lesion of the central nervous system.
Application
Intraoperative monitoring
Somatosensory evoked potentials provide monitoring of the dorsal columns of the spinal cord. Sensory evoked potentials can also be used during surgeries that put brain structures at risk. They are effectively used to determine cortical ischemia during carotid endotherectomy surgeries and to map sensory areas of the brain during brain surgery.
Electrical stimulation of the scalp generates an electrical current in the brain that activates the motor pathways of the pyramidal tracts. This method is known as transcranial electromotor potential (TcMEP) monitoring. This method effectively evaluates motor pathways in the central nervous system during operations that put these structures at risk. These motor pathways, including the lateral corticospinal tract, are located in the lateral and ventral funiculi of the spinal cord. Because the ventral and dorsal spinal cords have separate blood supplies with very limited collateral flow, anterior horn syndrome (paralysis or paresis with some preserved sensory function) is a possible surgical complication, so motor tract-specific monitoring as well as dorsal column monitoring is important.
Transcranial magnetic stimulation, compared with electrical stimulation, is generally considered unsuitable for intraoperative monitoring because it is more sensitive to anesthesia. Electrical stimulation is too painful for clinical use in awake patients. Thus, the two methods are complementary: electrical stimulation is the choice for intraoperative monitoring and magnetic stimulation for clinical applications.
Evoked potentials in pharmacological research
At the moment, some optimism is inspired by the use of the method of independent components in the analysis of evoked potentials, which can most effectively assess the functioning of brain systems and, therefore, is characterized by a large effect size of the studied pharmacological drug.
This approach consists of several stages:
- In a representative group of healthy subjects (normal) under the conditions of a certain test task, EP is recorded;
- Using the method of independent components, the EPs averaged over the group of subjects are decomposed into individual components. The detected components generated in different areas of the cortex are characterized by different dynamics of temporary activity and are independent of each other;
- Patients are given the same test task as in the control group, before and some time after pharmacological intervention;
- Using spatial filtering based on the topography of the components identified during the analysis of EPs of subjects in the control group, the EPs recorded in patients are decomposed into components;
- Before treatment, components that deviate from the norm are identified in patients.
- An assessment is made of the effect of treatment on components that deviated from the norm before pharmacological treatment.
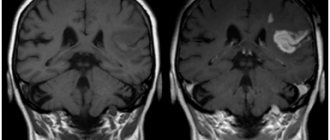
The result of applying the approach is shown in the figure, which shows the evoked potentials of a child (boy) with attention deficit hyperactivity disorder (ADHD). Before treatment, the patient had a selective deviation from the norm in the amplitude of the N1/P2 component of the auditory EP. This component was recorded on EPs obtained in response to the second stimulus of a presented pair (plant, person + new sound stimulus) and, as expected, reflected the novelty effect—the brain’s response to an unexpected new stimulus. As can be seen, one hour after taking Ritalin, the N/N1/P2 component of this patient almost reached normal values.
VP in pharmacological research
A. Novelty component, or N1/P2 component (thin line), obtained by constructing the EP of a child (boy) with ADHD, before and 1 hour after taking Ritalin in comparison with the independent component calculated from the array of EP data from a group of healthy subjects (thick line). A. Difference wave (dashed line) obtained by comparing the patient's novelty component and the component obtained on a group of healthy subjects. B. Topograms of the ratio of the spectral power of theta and beta rhythms, calculated in a group of normal subjects and in a patient before and after taking Ritalin.