Toxoplasmosis on MRI of the brain Magnetic resonance imaging is a painless and informative way to study the brain. Layer-by-layer MR scanning allows you to examine in detail all parts of the organ and evaluate their structure. Using certain sequences, it is possible to study in detail the white and gray matter, blood vessels, and ventricular system.
MRI is considered an effective method for identifying focal brain lesions. These include limited areas with a disturbed structure inside the substance of the organ. Such changes are often accompanied by mass effect, swelling, and deformation of the surrounding areas. Lesions in the brain on MRI appear as areas of change in the MR signal. Based on specific features, location, size and degree of influence on surrounding structures, the radiologist can make assumptions about the nature of the pathology. Using the information listed, the doctor makes a diagnosis, makes a prognosis for the patient and selects treatment.
Lesions on MRI of the brain: what does it mean?
The result of magnetic resonance imaging is a series of layer-by-layer images of the area under study. In the images, healthy tissue appears as alternating light and dark areas, depending on the concentration of fluid in it and the pulse sequence used. Based on the sections, the radiologist evaluates:
- development and position of individual structures;
- compliance of the MR signal intensity with the norm;
- condition of the gyri and grooves;
- size and structure of the ventricular system and subarachnoid space;
- parameters of the ear canals, orbits, accessory sinuses;
- structure of the vascular bed;
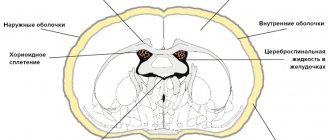
- structure of cranial nerves and cerebral membranes;
- the presence of signs of pathology (focal changes, swelling, inflammation, damage to the walls of arteries and veins).
Lipoma of the quadrigeminal cistern on MRI (circled)
MRI is prescribed if the patient has neurological abnormalities due to damage to brain tissue. Symptoms may include:
- headache;
- impaired coordination of movements;
- dysfunction of the organs of hearing or vision;
- disturbances in concentration;
- memory disorders;
- sleep problems;
- psychoemotional disorders;
- paresis/paralysis of the limbs and/or facial muscles;
- sensory disorders;
- seizures, etc.
Magnetic resonance imaging of the head allows the doctor to accurately determine the location of focal changes and find out the nature of the patient’s poor health. At the Magnit DC, specialists are armed with the latest MR scanning devices, which allow them to conduct research with high reliability.
Meningioma: what is it?
As a rule, meningioma is benign in nature, however, like any other tumor localized inside the skull, benign meningioma of the brain is considered relatively malignant, accompanied by symptoms associated with compression of the brain matter. Malignant brain tumor (meningioma) is a less common disease characterized by aggressive growth and a high recurrence rate after surgical treatment.
Most often, brain meningioma is localized in the area of the foramen magnum, cerebral hemispheres, pyramid of the temporal bone, wings of the sphenoid bone, tentorial notch, parasagittal sinus and cerebellopontine angle.
In most cases, meningioma is located in a capsule. The tumor is not characterized by the formation of cysts; it can be small, just a few millimeters, or reach large sizes - over 15 centimeters in diameter. If a meningioma grows towards the brain, a node forms, which over time begins to compress the medulla. If a tumor grows towards the bones of the skull, over time it grows between the cells of the bone and causes thickening and deformation of the bone. The tumor can grow simultaneously towards the bone and brain, then nodes and deformation of the skull bones are formed.
Make an appointment
Types of lesions on MRI of the head
The color of the resulting image of normal brain structures and pathological changes depends on the program used. When scanning in angio mode, including using contrast, a branched network of arteries and veins appears on the images. Focal changes are of several types; based on their characteristics, the doctor can guess the nature of the foci.
With pathology of the medulla, the properties of the affected foci are disrupted, which is manifested by a sharp change in the MR signal compared to healthy areas. The use of certain sequences (diffusion-weighted, FLAIR, etc.) or contrast allows for more clear visualization of local changes. That is, if a radiologist sees a single lesion on the MRI results, different scanning modes or contrast will be used to study it in more detail.
When comparing changes with healthy areas of the brain, hyper-, hypo- and isointense zones are identified (bright, dark, and the same color as adjacent structures, respectively).
Brain abscess on MRI (indicated by arrow)
Hyperintense lesions
Identification of hyperintense, i.e. foci that clearly stand out on MR scans makes the specialist suspect a brain tumor, including of metastatic origin, hematoma (at a certain moment from the onset of hemorrhage), ischemia, edema, vascular pathologies (cavernomas, arteriovenous malformations, etc.), abscesses , metabolic disorders, etc.
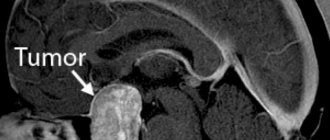
Brain tumor on MRI (indicated by arrow)
Subcortical lesions
Damage to the white matter of the brain is usually characterized as changes in subcortical structures. Subcortical lesions identified by MRI indicate that the damage is localized just under the cortex. If multiple juxtacortical lesions are detected, it makes sense to suspect a demyelinating process (eg, multiple sclerosis). With this pathology, destructive changes occur in various areas of the white matter, including directly under the cerebral cortex. Periventricular and lacunar lesions are usually detected during ischemic processes.
Foci of gliosis
When brain tissue is damaged, compensatory mechanisms are activated. Destroyed cells are replaced by glial structures. The latter ensures the transmission of nerve impulses and is involved in metabolic processes. Due to the structures described, the brain recovers from injuries.
Identification of glial foci indicates previous destruction of the cerebral substance due to:
- birth trauma;
- hypoxic processes;
- hereditary pathologies;
- hypertension;
- epilepsy;
- encephalitis;
- intoxication of the body;
- sclerotic changes, etc.
By the number and size of altered areas, one can judge the extent of brain damage. Dynamic observation allows you to assess the rate of progression of the pathology. However, by studying the zones of gliosis, it is impossible to accurately determine the cause of the destruction of nerve cells.
Foci of demyelination
Some diseases of the nervous system are accompanied by damage to the glial membrane of the long processes of neurons. As a result of pathological changes, the conduction of impulses is disrupted. This condition is accompanied by neurological symptoms of varying degrees of intensity. Demyelination of nerve fibers can be caused by:
- multifocal leukoencephalopathy;
- multiple sclerosis;
- dissimulating encephalomyelitis;
- Marburg's disease, Devic's disease and many others.
Typically, demyelination lesions appear as multiple small areas of hyperintense MR signal located in one or more parts of the brain. Based on the degree of their prevalence, duration and simultaneity of occurrence, the doctor judges the scale of development of the disease.
Focus of demyelination on MRI
Focus of vascular origin
Cerebrovascular insufficiency causes ischemia of the cerebral substance, which leads to changes in the structure and loss of function of the latter. Early diagnosis of vascular pathologies can prevent stroke. Focal changes of discirculatory origin are found in most patients over 50 years of age. Subsequently, such zones can cause degenerative processes in the brain tissue.
Lacunar cerebral infarction on MRI (indicated by arrow)
Cerebral circulation disorders can be suspected by focal changes in the perivascular Virchow-Robin spaces. The latter are small cavities around the cerebral vessels, filled with fluid, through which tissue trophism and immunoregulatory processes occur (blood-brain barrier). The appearance of a hyperintense MR signal indicates expansion of the perivascular spaces, since they are normally not visible.
Sometimes an MRI of the brain reveals multiple lesions in the frontal lobe or in the deep parts of the hemispheres, which may indicate damage to the cerebral vessels. The situation is often clarified by MR scanning in angio mode.
Foci of ischemia on MRI
Foci of ischemia
Cerebral circulation disorders lead to oxygen starvation of tissues, which can provoke necrosis (infarction). Ischemic lesions on T2-weighted sequences appear as areas with moderately hyperintense signal of irregular shape. At a later stage, when performing MRI in T2 VI or FLAIR mode, a single lesion takes on the appearance of a light spot, which indicates a worsening of destructive processes.
Pseudoneurosthenic syndrome
Another characteristic sign of changes in blood circulation in the brain are mental disorders of vascular origin. Their symptoms coincide with the classical picture, but changes occur as a result of circulatory disorders.
Accordingly, treating only the mental component will not lead to the desired result: in this case, the disorder is a secondary disease.
- Very often, sleep disturbances occur against the background of a headache and a feeling of heaviness in the back of the head. As a rule, sleep is shallow, short - 3-4 hours, accompanied by natural weakness and a state of “being overwhelmed”. If the cause is poor venous blood flow, then physical activity brings your health back to normal much faster.
- Sensitivity to stimuli - sound, light, sometimes even dim light.
- Tearfulness, irritability, unstable attention. Moreover, the patient is clearly aware of the painfulness of the condition.
- It is difficult to remember new events and record them; chronological orientation is often disrupted: it is difficult to remember the date, day, or date the event.
- The search for small objects - glasses, keys, notepads - is associated with a refusal to perceive certain objects in the field of vision.
- With the further development of diseases of vascular origin, personality changes are possible - a kind of sharpening of the most striking character traits. At the same time, asthenic structures intensify – self-doubt, anxiety, suspiciousness. Gloomy dissatisfaction with others becomes almost constant. Personality changes are noticeably influenced by the nature of the vascular process: arterial hypertension, the location of focal lesions in the brain, and so on.
Unlike true mental disorders, treatment of vascular diseases is carried out mainly by medicinal methods and is quite successful.
What do white and black spots mean on MRI images?
Zones of altered MR signal may indicate:
- tissue ischemia;
- edema;
- necrosis;
- purulent melting;
- tumor transformation;
- metastatic lesion;
- gliosis;
- demyelination;
- degeneration, etc.
The radiologist describes the signal intensity, size and location of the lesion. Taking into account the information received, the patient’s complaints and data from previous examinations, the specialist can assume the nature of the pathological changes.
Acute disseminated encephalomyelitis on MRI
Relapses
If a benign, clearly circumscribed meningioma that has not grown into the surrounding tissue is detected in a patient, surgical intervention most often ensures a complete recovery.
However, it must be remembered that after removal of even benign meningiomas, relapses can occur. Recurrences of atypical meningiomas are recorded in almost 40% of cases, of malignant ones - in 80%.
The development of relapses within five years after surgery also depends on the location of the tumor.
Relapses are least likely to occur with meningioma localized in the cranial vault, more often in the area of the sella turcica and the body of the sphenoid bone. The most common tumors that recur are those affecting the sphenoid bone and cavernous sinus.
Superficial location of the lesion focus
EEG of a patient with a convexital astrocytoma of the right frontal lobe growing through the cortex.
A clearly limited focus of δ-waves in the right frontal region (leads F and FTp).
Pathological formations themselves (tumors, abscesses), foreign bodies, as well as brain tissue in a state of severe damage (infarction area, area of brain contusion) do not generate electrical activity. Pathological changes in the EEG with superficially located convexital pathological foci are thus caused by a restructuring of activity in the tissue immediately adjacent to the area of the pathological focus. In general, changes in the EEG with a superficially located lesion focus are characterized by an area of pathological activity corresponding to the localization (Fig.). Since the pathological formations themselves do not generate electrical activity, they are characterized by a so-called zone of electrical silence.
It should be noted, however, that while there is an undoubted presence of such a zone on the EEG taken directly from the open brain, on the scalp EEG it is observed only as an exception. This is explained by the fact that with bipolar electrocorticography, two electrodes can be positioned so that they are located above the area of the tumor or other pathological formation. In electroencephalography, in order to obtain a recorded potential difference, the distance between the electrodes must be sufficiently large, so that one of the electrodes will necessarily stand above the functioning brain tissue, and therefore producing electrical potentials. As a result, a zone of “electrical silence” is usually not observed on the scalp EEG. In some cases, with very extensive destructive lesions, using multiple combinations of different bipolar leads, it is possible to detect a zone of relative decrease in pathological activity in the center of an area of higher amplitude pathological oscillations, which may serve as an indication of the location of the focus of cortical destruction or tumor at this location123.
The most indicative and systematically used criterion in determining the localization of a superficial pathological focus is the oscillation frequency. In all cases, a characteristic dependence is observed, which is expressed in the fact that the closer the brain tissue is located to the focus of the lesion, the slower the waves it generates. In the immediate vicinity of a tumor or other pathological formation, δ-waves with a frequency of 0.5-1.5 per second are usually recorded; as we move away from the epicenter of the pathological process, δ-waves with a frequency of 2-3 per second appear, then θ-waves, which gradually pass into a-activity. The functional organization of brain tissue in the vicinity of the destructive area undergoes dynamic restructuring with disruption of excitatory-inhibitory interaction between neighboring groups of neurons, often leading to pathological overexcitation and the occurrence of hypersynchronous epileptiform discharges, which, as is known, has clinical correlates. As for the amplitude of pathological oscillations, with the exception of the described situation of a decrease in amplitude directly in the area of destroyed brain tissue or tumor, in functioning brain tissue the amplitude of pathological waves is highest in the perifocal zone of the pathological formation. Thus, with a superficially located pathological focus, the general rule for determining its localization is to search for the zone of the slowest and highest amplitude oscillations on the EEG.
In the cases discussed above, we naturally sought to focus attention on those aspects of pathophysiological relationships that are characteristic of each of them, deliberately distracting from accompanying and incidental factors. When using the general rules we have given for assessing the EEG and its changes in various pathological conditions, it is necessary to take into account that each specific case has its own characteristics, and various types of lesions of the nervous system are almost never observed in isolation. All of these possible combinations should be taken into account when interpreting specific EEGs. It is also useful to adhere to the general rule: in cases that are difficult to interpret, refrain from giving confident and detailed clinical conclusions and limit yourself only to that amount of useful diagnostic information that can be reasonably confidently and unambiguously extracted from the EEG data. Attempts to interpret EEG using far-reaching logical constructions, as a rule, give inadequate results and lead to discrediting the method.
Three-dimensional localization of sources of electrical activity of the brain in the Encephalan-3D program
➥Main article: Encephalan-3D program
To localize the sources of electrical activity of the brain, the Encephalan-3D program uses a homogeneous head model with correction coefficients, but it is also possible to use a three-layer model (Agu et al., 1981; Musha et al., 1987).
The program processes EEG fragments selected for localization and saves the localization results in the EEG study file. The ability to view the localization result of each fragment separately has been implemented (Fig. 1). The localization process is monitored using an accuracy assessment graph. In the case of a single-dipole model, it is convenient to observe the behavior of a dipole using the curves of its movement over time in three standard projections (Fig. 2.). The dynamics of changes in dipole energy are also presented here. Representation of the dynamics of changes in dipole coordinates, its energy and accuracy in the form of graphs facilitates the interpretation of the trace and makes it possible to identify moments when dipoles switch, for example, in the presence of mirror foci. There is a possibility of preliminary control of the adequacy of the used dipole model to the current distribution of the potential field. This allows you to speed up the process of tracing a selected fragment of a record, without performing calculations on those time slices at which a deliberate discrepancy with the model is determined. The adequacy of the selected model is checked at each time slice by the number of clearly expressed focuses. The localization program notifies the researcher of any selection discrepancies, after which the process can be paused and the model adjusted.
The program monitors and localizes oculomotor artifacts. To do this, in the presence of oculographic activity, two stationary dipoles are installed in the area of the eyeballs. Using a mixed model with two stationary dipoles allows us to obtain a more compact dipole cloud with less influence of oculographic artifacts. However, calculations using a mixed three-dipole model take much longer than calculations using a single-dipole model. Therefore, on an EEG fragment with an electrooculogram, it is first necessary to eliminate the influence of the oculogram using the method of automatic artifact suppression, and then apply a single-dipole localization model.
Considering the possibility of accumulation of a large number of dipoles on each of the three projections of the head, the Encephalan-3D program provides a very convenient function for scaling (increasing) any of the projections. Color scaling of the energy level of dipoles and display of their directional vectors allows us to select the most significant ones from the entire set of dipoles. Selecting a dipole in the window with an enlarged image of the head projection leads to a corresponding change in the information on all other panels (Fig. 3.):
- on the EEG graph the marker will be set to a position indicating the time slice of this dipole;
- on the graphs of the dynamics of dipole parameters, the marker will be set to a position indicating the time slice of this dipole;
- the primary and restored potential maps will be redrawn;
- digital values of coordinates, accuracy and energy will be updated;
- on all projections of the brain, the selected dipole will be marked with a vector that differs in color from the other vectors.
Rice. 1. Window of the Encephalan-3D program. An example of localization of the source of paroxysmal EEG activity in the anterior temporal region with left-sided literalization.
Rice. 2. Representation of the dynamics of the parameters of the dipole and the trajectory of its spatiotemporal movement.
Rice.
3. Time synchronization of individual windows of the Encephalan-3D program. The main purpose of using the Encephalan-3D program is to obtain additional information that allows a more accurate assessment of the localization of possible signs of pathological activity; this is most often used for epileptiform activity. This three-dimensional localization of sources is used as an auxiliary method, especially in cases where the focus of pathological activity does not have obvious morphological changes and is not detected by CT and MRI.
Three-dimensional equivalent dipole localization method
An electroencephalogram recorded from the scalp is formally a manifestation of the surface potential difference between convexitally located electrodes. However, through the efforts of a whole galaxy of neurophysiologists, signs on the EEG have been identified with a sufficient degree of evidence, which are already recognized without any element of doubt as either cortical components or deep ones. This applies to both physiological and pathological elements. Moreover, the superficially recorded graphical components of the EEG have a complex genesis of occurrence, and the cortical level itself is largely a projection zone of the maximum manifestation of electrical phenomena rather than the place of their generation.
Rice. 1 Three-dimensional localization of the equivalent dipole source (right) of discharge activity on the EEG (left).
BrainLoc program
One of the methodological techniques that makes it possible to localize an activity generator is the method of three-dimensional localization of an equivalent dipole.
Essence of the method
The essence of the method is that the source of the electrical signal is taken to be the presence of a certain dipole unit, i.e., an object that includes both a minus and a plus charge, which fully describes the distribution of potentials on the scalp EEG for a selected period of time. Depending on the direction of the dipole at a particular moment in time, the maxima of the potential distribution are projected onto the surface of the scalp according to its poles. The presence of the dipole's directional vector allows us to calculate its location in three-dimensional space in the Cartesian coordinate system (X, Y, Z) with reference to the anatomical landmarks of the brain. In other words, the inverse EEG problem is solved: calculating the position of the dipole from the same generated electrical potentials on the scalp (Fig. 1).
The method of three-dimensional localization of the source of electrical activity is not independent, but only complements computer electroencephalography. To implement it, special programs for analyzing dipole sources are required. The most common program in our country is BrainLoc (developed by Yu. M. Koptelov). It is compatible with computer electroencephalographs from many domestic and foreign companies.
In a short period of time, the method of three-dimensional localization of the source of electrical activity of the brain was tested by verification using CT, MRI methods and based on the results of neurosurgical operations. The results of studies were summarized in which it was possible to find a coincidence of zones of generation of pathological electrical activity and rough structural organic foci.
Stages of the 3D source localization method
The entire process of EEG analysis using the three-dimensional source localization method should be divided into several stages:
- selection of EEG fragments for analysis;
- choice of lead system and their number;
- elimination of artifacts and targeted filtering of EEG;
- preview of the results obtained (selection of the confidence level, assessment of the dipole of the source using potential maps);
- reference channel selection;
- selection of dipoles (amplitude cutoff points) along the reference channel;
- localization of the source of electrical activity in three-dimensional space on a model of the head in three projections or on schematic sections of the brain;
- clinical interpretation of the obtained data.
The choice of EEG fragments and their duration depends, first of all, on those components of the electroencephalogram, the source of which is supposed to be localized. These components can be both physiological rhythms (alpha, theta and even beta waves) and pathological ones (outbursts, paroxysms, epileptiform complexes). Methodological techniques for high-amplitude components are usually the same; for low-amplitude components it is necessary to use additional ones (narrow-band filtering, increasing the number of analyzed leads, etc.).
It is believed that the more channels recorded, the more accurate the calculation. The standard requirement is 19 channels. It is acceptable to limit yourself to 16 channels. This is, first of all, relevant in pediatric practice, since the characteristics of the impatient population and the small size of the head in children are the objective reality of doctors’ desire to reduce the number of electrodes on the head.
Requirements for EEG analysis
When processing and calculating the localization of the source of pathological activity, the mandatory requirements for the EEG fragment to be analyzed are as follows:
- the element of interest on the native EEG must be well formed;
- the EEG fragment should not contain artifacts in any of the leads taken into account;
- in the presence of isoline drift, getting rid of it is an indispensable condition for qualitative analysis;
- the amplitude of the component of interest should clearly stand out among other EEG elements of a different origin;
- The EEG fragment for analysis should not be too long, the number of them should be sufficient to verify the reliability of the calculations.
Selecting a lead system and their number. Computer electroencephalography allows one and the same EEG fragment to be represented in different lead patterns. The reference lead system is a monopolar system with an ear reference (A), but it contains a greater number of artifacts. To eliminate artifacts, they resort to various options for bipolar leads. Which scheme should be preferred when using the 3D localization technique? It was expected that there would be no significant difference. In reality this turned out not to be the case (see Fig. 1).
Rice. 2. Depth flash
with a monopolar reference lead system (a) and with an averaged electrode Av (b) of the same EEG time period. With the reference lead system, the generalized flash is well expressed, with the scheme with an averaged electrode it is absent
If the source of the electrical signal recorded on the surface of the head is located on the mediobasal surface of the hemispheres or at the level of the lower brainstem, then its well-visualized components with a monopolar reference lead system, with a bipolar lead system or with an averaged electrode can “disappear” almost completely (Fig. 2). With a higher location of the source of electrical activity (in the upper brainstem or in the cerebral hemispheres), they, on the contrary, are quite often “amplified” in bipolar leads and with an averaged electrode.
For clarity, you can compare the circuit with an averaged reference electrode with a myopic person. This scheme, as in myopia, allows one to see very clearly what is happening in the relative proximity of the convexital surface of the head, vaguely in the middle parts of the brain and absolutely nothing in the lower brainstem and basal parts of the brain. The monopolar lead system identifies both near-convex sources and deep objects. But at the same time, they can all be layered on top of each other, which makes it difficult to isolate them.
Thus, the choice of the outlet system is determined by the “depth of occurrence” of the source. An EEG fragment is first viewed in a monopolar lead system with an ear referent, then in a montage with an averaged electrode or in a bipolar montage. In which option the fragment of interest is visualized better, its source should be calculated. You should focus on the reference channel. As the latter, one of the channels of the electroencephalogram is used, in which the element under study is represented with maximum amplitude.