The development of depressive states is accompanied by disturbances in the structure of all frequency ranges of the EEG. To a greater extent, these changes relate to the main EEG rhythm - the alpha rhythm [1, 5, 7, 10, 11, 18-20, 23].
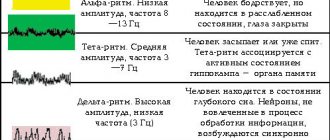
Alpha rhythm - rhythmic oscillations with a frequency of 8-14 Hz and an average amplitude of 30-70 μV are recorded mainly in the occipital regions with the eyes closed in a state of quiet wakefulness and the maximum possible muscle relaxation. The rhythm is blocked by light stimulation, concentration and mental stress [2, 6, 9, 14, 15]. According to modern concepts, the generation of the alpha rhythm is associated with the reverberation of impulse activity along the intercortical and thalamo-cortical neural networks, and its severity determines the synchronization of the functional activity of various brain systems and, in particular, determines the connection of the information received from the afferent system of the body to the mechanisms of RAM, regulating adaptation processes. The alpha range in depression can significantly increase or decrease, and the spatial distribution of the rhythm also changes [3, 4, 16, 17]. Changes in alpha activity in depression depend on the clinical picture of the disease. Thus, an increase in the alpha rhythm index is characteristic of patients with “major depression,” and its decrease is characteristic of a desynchronized type of EEG in dysthymic disorders [24]. A number of researchers associate the peculiarities of changes in alpha activity with the dominance of melancholy, anxious or apathetic affect [8, 12, 13], thereby confirming the generally accepted position about the connection between the EEG structure and the functional activity of cortical zones. Since the clinical picture of depression changes throughout the day, the characteristics of the alpha rhythm in patients cannot remain unchanged. However, this question requires clarification.
The purpose of this work was to identify the characteristics of EEG alpha activity in the morning and evening hours in patients with endogenous depression.
What is alpha rhythm depression?
Electroencephalography (EEG) shows the alpha rhythm as a rhythmic wave in the cortex with a frequency range of 8-12 Hz. Unlike other frequencies, this wave has an unusual sinusoidal, smoother shape. From a physiological point of view, this means how inactive the visual system of the brain is; from a psychological point of view, it is a kind of connection between a person’s consciousness and the subconscious.
https://www.instagram.com/p/BxOnQ64npWj/
Alpha rhythm is often associated with inhibited brain activation. The greater the range of fluctuations in the indicator, the less the brain works in the area where it was recorded. The index has clearer indicators when examining the occipital and parietal regions, as well as the posterior wall of the temple.
Depression is the replacement of alpha with beta rhythm.
The meaning of the alpha rhythm for humans
For a person, the normal functioning of the alpha rhythm is extremely important, because responsible for the following brain actions:
- analysis of information received during the day;
- activation of the parasympathetic nervous system to restore the body's resources;
- normal cerebral circulation;
- stabilization of the limbic system;
- normalization of post-traumatic syndrome due to a stressful situation.
Disruption of the alpha rhythm can lead to alcohol or drug addiction. This disorder also causes excessive eating and bulimia, because... there is a failure in normalizing the basic needs of the body.
There is also incomplete depression, which provokes disruptions in the human cardiovascular system. Incomplete depression leads to a large number of negative thoughts and a person becoming fixated on some problems.
Material and methods
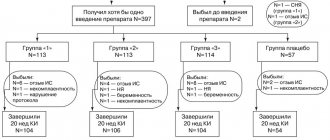
18 patients with endogenous depression were examined. The diagnosis of the disease according to ICD-10 was determined by categories F31.3, F31.4, F32.0, F32.1, F32.2, F33.0, F33.1 and F33.2. Among the patients there were 9 women and 9 men aged from 24 to 52 years (average - 31.2±2.4 years). The duration of the disease ranged from 2 to 10 years (average 7.8±1.7 years).
In 9 patients, the type of disease was classified as recurrent depressive, in 9 - as bipolar. The number of affective phases experienced, including the last one, ranged from 2 to 10 (average 4.1±1.3).
The structure of the depressive state during the examination period was dominated by melancholy, anxious and, less often, apathetic affects. In the overwhelming majority of cases, there was a combination of basic elementary affects with the dominance of one of them. The severity of depression on the Hamilton scale (HAM-D) was 19-23 points [22].
The study was conducted when patients were admitted to the hospital in the spring.
Using the lateral traits questionnaire [21], right-handers were selected for the group of subjects.
The EEG was recorded using a hardware-software complex for topographic mapping of electrical activity of the brain NEURO-KM (Russia) with a bandwidth from 0 to 40 Hz and a time constant of 0.3 s. EEG recordings were carried out monopolarly from symmetrical frontal (F3, F4), central (C3, C4), parietal (P3, P4), occipital (O1, O2), anterior temporal (F7, F8), middle temporal (T3, T4) and posterior temporal ( T5, T6) cortical zones (scheme 10-20%, even channels are leads from the cortical zones of the right hemisphere, odd ones - from the left). Integrated ear clips served as the reference electrode. The characteristics and topographic distribution of EEG rhythms were determined using spectral analysis of the EEG using the fast Fourier transform method with averaging of at least 30 epochs of 2 seconds each, followed by mapping using the BRAINSYS system (Russia). Spectral and coherence EEG analyzes were performed. The magnitude of coherence (COG) in the alpha range was calculated between all 14 leads of the cortical areas. The value of the average COG of each region with all other cortical zones was determined - an indicator of the selected zone in the integrative activity of the brain. EEG recording was carried out on a background free from drug therapy - before the start of therapy or 5-7 days after discontinuation of psychotropic drugs, provided that the disease state has stabilized and obvious vegetative and other manifestations of “withdrawal syndrome” have disappeared.
EEG recordings for each patient were carried out twice during the day: in the morning (from 8 to 10) and in the evening (from 17 to 19), and then a pairwise comparative analysis of the EEG of these recordings was carried out.
Possible reasons
Signs of pathological changes in fluctuations of this index in an adult patient are:
- asymmetry of the human brain hemispheres by more than 30%;
- violation of sine wave indicators;
- delta and theta rhythms;
- unstable parameters.
During an EEG study, fluctuations in the forehead area should be clearly visible when the eyes are opened, and should disappear when closed. If this does not happen, then there is a high probability that there is an injury in this place. Clear asymmetry of the hemispheres may be a sign of brain cancer or various lesions as a result of a heart attack or stroke.
These indicators may also indicate changes in the brain as a result of injury. If a malfunction is observed in children, this may be a sign of some kind of mental pathology. It is more difficult to determine fluctuations in children, because a small child cannot close or open his eyes on command.
The violation is a sign of the presence of epileptic brain damage, drug addiction, severe deviations of the organ hemispheres, and hypertension. High fluctuations indicate that the patient may have mental retardation.
Results and discussion
Data from visual and spectral EEG analyzes
The most pronounced changes in the background EEG, both in the morning and in the evening, were noted in the form of two variants: low-amplitude dysrhythmia (22.2%) and increased synchronization in the alpha range (61.1%). In the first case, there was a reduction in the alpha rhythm, smoothing of regional differences in the alpha index, a decrease in the amplitude of bioelectrical activity, and an increase in diffuse slow-wave activity. In the second variant of the disorders, the presence of bilateral bursts of alpha and theta waves was observed, occurring synchronously in all areas and indicating irritation phenomena at the level of brain stem structures. A characteristic feature of the alpha rhythm in the development of endogenous depressive disorders, regardless of the time of day, was the weak expression or complete absence of modulation in the spindles.
The highest spectral power (SP) of the alpha rhythm in individual cortical zones was observed in the morning, and the range of values varied from 87.1 to 24.4 μV2. In the evening hours, SM values were lower and ranged from 69.6 to 15.6 μV2. In Fig. Figure 1 shows the morning-evening dynamics of the alpha rhythm.
Figure 1. Comparative analysis of the SM of the alpha rhythm in individual cortical zones in patients with endogenous depression in the morning and evening hours. The abscissa axis is the leads; S/SP—average SM value for all cortical zones; along the ordinate axis - SM. In all cortical zones (except for the middle and posterior temporal ones on the right), SM is higher in the morning than in the evening. The greatest differences were observed in the occipital regions.
Both morning and evening recordings in endogenous depressive disorders were characterized by a transition of the modal value of the alpha rhythm frequency to a lower range - 9-10 Hz (versus 10-11 Hz in healthy subjects), which reflects the adaptation of cortical rhythms to function in more energy-saving modes . Slowing of the alpha rhythm is more typical for morning EEG recordings. In Fig. Figure 2 shows the structure of the alpha rhythm in the form of the average spectral density (SP) across all cortical areas in the morning and evening hours.
Figure 2. Average spectral density (y-axis) for all cortical zones in patients with endogenous depression in the morning and evening hours. Here and in Fig. 4: * — p<0.05 compared to the evening. The SP of the 8-12 Hz alpha rhythm bands is higher in the morning compared to the evening.
Despite the fact that only right-handers were included in the study group, when mapping the group spectral characteristics of the EEG, the focus of the alpha rhythm was unclearly defined in the right occipital region, and in some cases was detected in the occipital region of the left hemisphere. More pronounced changes in the alpha rhythm topic compared to the “norm” were observed in the morning.
The interhemispheric balance of the generation of maximum alpha activity in patients changed throughout the day. These data are presented in the table.
In the morning, SP values in the left and right occipital regions were almost equal - in the left occipital region SP was 82.6 μV2, and in the symmetrical zone of the right hemisphere 85.5 μV2, which reflects the leveling of interhemispheric asymmetry.
In the evening hours, a higher index was recorded in the right occipital zone - 72.7 μV2, and on the left - 57.0 μV2, i.e. the focus of the alpha rhythm in the occipital zone on the right reflects the normalization of functional balance. Correlations of the same type were observed both in individual cortical zones and in the hemispheres as a whole.
The patients showed a wide range of variation in the average frequency of the alpha rhythm in individual cortical areas, especially in morning EEG recordings. The range of variability of this parameter in the morning is from 8.7 to 10.1 Hz, in the evening from 9.4 to 10.2 Hz. The maximum values of the indicator throughout the day were determined in the right occipital region.
Consequently, in patients with endogenous depression in the morning, compared to the evening, alpha activity generalized across all cortical zones is more pronounced, with a less clearly defined focus in the right occipital region. At the same time, there is a slowdown in the alpha rhythm, as evidenced by the structure and indicator of the average frequency of the alpha rhythm, reflecting a decrease in the functional activity of the cortical zones.
EEG coherence analysis data
In patients with endogenous depression, a comparative analysis of the average COG values of the alpha rhythm in individual cortical zones (Fig. 3) in the morning compared to evening recordings revealed higher COG values in the parietal-central regions of both hemispheres, as well as in the anterior and middle temporal zones on the right.
Figure 3. The difference in the average COG morning-evening (ordinate axis) for individual cortical zones in the alpha range in patients with endogenous depression. In the occipital and posterior temporal regions, COG indices are lower in the morning than in the evening. These data reflect an increase in functional tension in the morning hours of the cortical projection zones of the upper brainstem structures, including the diencephalic level, as well as the right-sided temporal areas, which have closer connections with the brainstem structures. Participation in the integrative activity of the brain of areas with the most pronounced alpha activity (occipital and posterior temporal) in the morning hours is lower than in the evening hours. Hyperactivation of the above zones in the morning determined higher COG values in the morning both throughout the alpha range and in individual frequency bands. In Fig. Figure 4 shows unidirectional dynamics - higher COG values in the morning compared to the evening.
Figure 4. Comparative analysis of the average COG for all cortical zones in separate frequency bands of the alpha range in patients with endogenous depression in the morning and evening hours. * — p<0.05. Moreover, more significant (p <0.05) differences between morning and evening EEG recordings were recorded at the upper limit of the alpha range of 13-14 Hz, and the smallest at the lower limit - 8-9 Hz.
For both morning and evening recordings, a certain pattern was noted, which can be described in the form of a parabola, expressed in a decrease in COG with an increase in frequency in the continuum from 8 to 12 Hz with its further increase in the band of 13-14 Hz. The lowest COG values in morning recordings were noted in the 11-12 Hz range, in the evening - 12-13 Hz, and the highest, both in morning and evening recordings, in the 8-9 Hz band. From a theoretical point of view, the decline in coherence in the 11-13 Hz range is interesting, forming the lower point of the parabola and, as it were, splitting the coherence of the alpha spectrum into two peaks 8-9 and 13-14 Hz, characterized by relatively higher COG values. Such a splitting of the alpha spectrum into low- and high-frequency components reflects the genetic heterogeneity of the rhythms included in the alpha range. Thus, activity of 8-10 Hz is more specific for resonant oscillations of thalamo-cortical loops, and 12-14 Hz is “typical” for pacemakers of the amygdala and hippocampus. This type of “splitting” has been described during spectral analysis of EEG under various conditions [2]. In addition, the absence of a monomodal peak of coherent EEG characteristics in patients indicates a mismatch in the integrative processes of the brain that arise during the development of depressive states and destroy the unified information processing system.
Both in the morning and evening hours, in patients with endogenous depressive disorders, the average COG of the right hemisphere of the alpha rhythm was higher than the average COG of the left hemisphere. However, the severity of interhemispheric asymmetry in the morning and evening was fundamentally different. When analyzing morning EEG recordings, the most pronounced differences in the tone of the right and left hemispheres were recorded in the 8-10 Hz band, the least pronounced in the 10-13 Hz band. In the evening, changes in interhemispheric balance were characterized by more significant differences in the high-frequency component of the alpha spectrum of 12-14 Hz, and less significant differences in the low-frequency component of 8-11 Hz.
The lowest COG values during the day were recorded in the evening along the left hemisphere in the range of 12-13 Hz, the highest in the morning along the right hemisphere in the range of 8-9 Hz.
Analysis of the COG of the interhemispheric balance during the day showed that in the morning hours, compared to the evening hours, the changes are not of the same type in different frequency bands. In Fig. Figure 5 shows the difference in average COG between morning and evening recordings.
Figure 5. The difference in the values of the average COG (ordinate axis) morning-evening in the alpha range in patients with endogenous depression. * — p<0.05. Deviations of the diagram columns from the isoline upward in all frequency bands of the alpha rhythm show that the coherence values are higher in the morning compared to the evening. Moreover, for the 13-14 Hz band, changes in coherence in both the left and right hemispheres correspond to p<0.05. In the range of 8-12 Hz during the day the right hemisphere is more dynamic, and in the band of 12-14 Hz the left hemisphere is more dynamic. This mosaic of changes (in low frequency bands the greatest dynamics of COG values is in the right hemisphere, in higher frequencies - in the left hemisphere) is probably due to the genetic heterogeneity of rhythms included in the alpha range with actualization in patients with endogenous depression of at least two relative autonomous pacemakers.
The data obtained in this study indicate that the chronobiological mechanisms of the development of depression are one of the fundamental components of the pathogenesis of depressive states, manifested by significant neurophysiological and clinical signs that require consideration during diagnosis and during therapy, i.e. they make it possible to improve the treatment process, primarily from the standpoint of chronotherapy. Increasing the effectiveness of therapy in this case comes down to optimizing the time of taking antidepressant drugs based on calculating the time required to create the maximum concentration of the drug in the blood plasma at the right time. Impact primarily on the daytime phases of the main circadian rhythms can contribute to the fastest exit from the state of pathological desynchronosis.
What to do?
Now there are a large number of methods for treating the disorder:
- medicinal;
- light therapy;
- psychotherapy.
Biofeedback therapy is quite common and involves constant monitoring of physiological parameters of the body over time. During the treatment course, physiological indicators are adjusted, for example, the functioning of the muscular system, blood circulation, and brain activity. This treatment allows people to cope with fears, panic attacks, and excessive muscle tension.
This method is most often used for headaches, spastic torticollis, stuttering, constantly shaking hands, high blood pressure, impotence caused by a psychological problem, and epilepsy.
Norms of rhythm indicators on EEG
Based on the EEG results, the doctor makes a conclusion, based on which the patient will be diagnosed and a treatment strategy will be determined. In this case, the individual characteristics of the body are taken into account - age, presence of chronic diseases, etc. Deviations in brain activity indicators may indicate a disease.
Alpha rhythm norms and disorders
These are oscillations, the frequency of which normally varies from 8 Hz to 14 Hz, and the maximum amplitude is limited to 100 μV. Signs of pathological changes in the alpha rhythm include:
- its stable fixation in the frontal areas of the skull;
- too large a difference in oscillations between the hemispheres (over a third);
- disrupted sinusoidality of the signal, distortion of the wave structure;
- high degree of frequency dispersion;
- a drop in amplitude below 25 μV or an increase above 95 μV.
The listed disorders indicate asymmetry of the hemispheres, which may be a symptom of the presence of a tumor, hemorrhage, stroke or other brain pathology localized in one hemisphere. Exceeding the frequency norm is a sign of injury to the skull or brain tissue.
Beta rhythm norms and disorders
Today, normal indicators are considered to be fluctuations from 3 μV to 5 μV, which is recorded in both hemispheres of the brain. Excessively high amplitude of beta rhythms may indicate a concussion. The so-called short spindles on the EEG are a sign of encephalitis. If the duration and frequency of spindles increase, this is a sign of inflammation of the brain tissue.
For children, beta rhythms, the frequency of which is stabilized within 15-16 Hz, and the amplitude lies between 40 μV and 50 μV, are considered a sign of pathology. The doctor is especially concerned about the localization of vibrations in the anterior or central zone of the brain. In this case, we can talk about the possibility of delays in the mental development of the baby.
Norms and disorders of delta and theta rhythms
Doctors may suspect a functional brain disorder if the amplitude of delta and theta rhythms increases to more than 45 microvolts and the increase is persistent. If such a picture is observed for all lobes of the brain, with a high degree of probability, we can talk about severe damage to the nervous system.
Excessively high amplitude of delta oscillations is often a symptom of tumor development. An increase in theta and delta indices, localized for the occipital part of the brain, is an alarming sign when recorded in a child: this may indicate a delay in his development, a retarded psyche, and even circulatory disorders in the brain.
Criteria for pathology when assessing α-rhythm
Disturbances of a functional or morphological nature primarily affect the parameters of the α rhythm.
- The constant presence of the α-rhythm (index >50%) in the frontal regions of the brain during bipolar recording from electrodes placed with small interelectrode distances (Fig. 2; 3).
- Amplitude interhemispheric asymmetry >30% (Fig. 4).
- Frequency asymmetry >1 oscillation/s (Fig. 5).
- Violation of the image: violation of sinusoidality of waves, lack of modulation, appearance of paroxysmal rhythm (Fig. 4, 6, 7). Presence of an arched α-rhythm (Fig. 6, 7).
- Changes in quantitative parameters, lack of stability in frequency, decrease in amplitude <20 μV or increase >90 μV, decrease in α-rhythm index <50% up to its complete absence (Fig. 5).
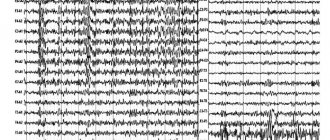
Rice.
2. Male, 45 years old. Cyst of the right temporal region. The electroencephalogram shows the constant presence of the α-rhythm (index >50%) in the frontal regions of the brain, the absence of modulation, the appearance of a paroxysmal α-rhythm, and a violation of the sinusoidality of the waves (A - monopolar montage; B - longitudinal bipolar montage)
Rice. 3. Woman, 60 years old. Panic attacks, sudden mood changes.
The electroencephalogram shows an amplitude interhemispheric asymmetry of the α rhythm >30%, a decrease in zonal differences, a violation of sinusoidality, and the presence of paroxysmal α waves
Rice. 4. Male, 16 years old. Cyst of the right anterior region.
The electroencephalogram shows amplitude interhemispheric asymmetry of the α rhythm >30%, lack of modulation, and the appearance of paroxysmal α waves
Rice. 5. Boy, 12 years old. Absence seizures.
The electroencephalogram shows a lack of stability in frequency, frequency asymmetry of the α-rhythm >1 oscillation/s, lack of modulation, disturbance of sinusoidality of waves, increased amplitude >90 μV
Rice. 6. Woman, 23 years old. Cyst of the right anterior region.
The electroecephalogram shows the constant presence of the α-rhythm in the frontal-central-parietal regions of the brain, the absence of modulation, and the appearance of an arched α-rhythm
Rice. 7. Woman, 63 years old.
Complaints of severe headaches and increased blood pressure. An electroencephalogram reveals the presence of an arched α-rhythm in the occipital regions of the brain and the absence of modulation. Doppler ultrasound revealed a circulatory disorder in the middle cerebral artery on the left